
You’ve been asked to sign this ECG for a 75year old lady who has been referred by her GP with SOB and ? Left zone consolidation on CXR.
Interpretation:
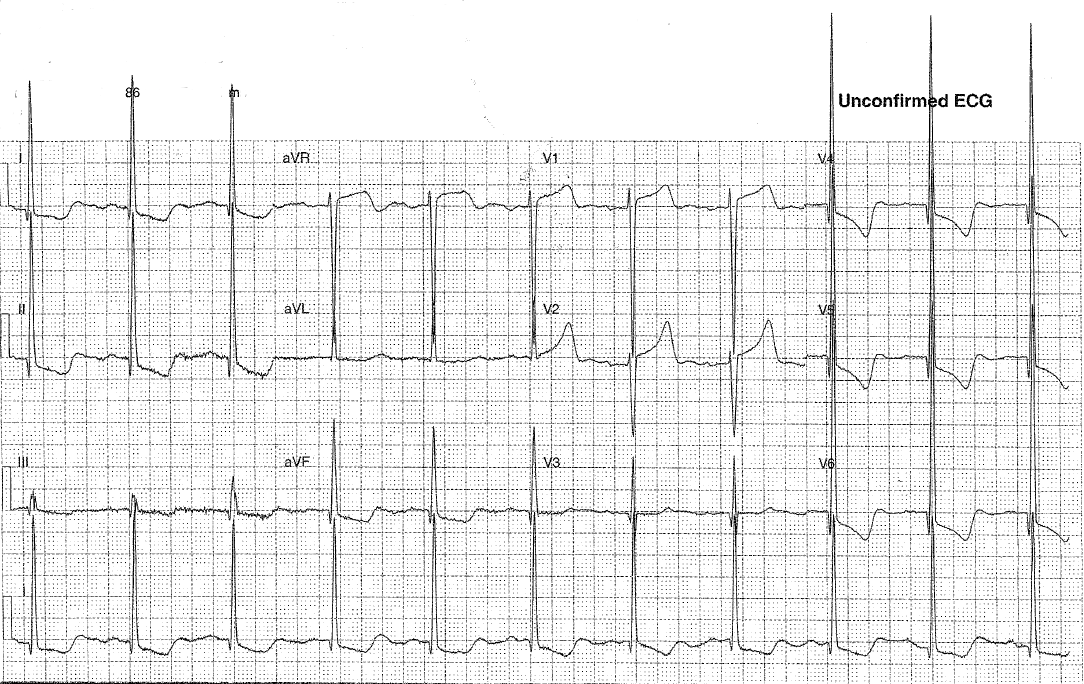
- Rate: 66
- Rhythm: normal sinus rhythm
- Axis: Normal 0-90
- Morphology: large voltage complexes (overlapping chest leads – SV2 + RV6 >35 approx 120), left sided STD 1-2mm with downscoping deep T waves, 1mm STD infr leads also with TWI, STE 2-3 mm in V1-2 and aVR, biphasic p waves, u waves seen V1-2, bifid p waves
- Intervals: Of note R wave peak time 80ms, p wave >110
- Summary: Abnormal ECG – high QRS voltages and abnormal ST/T waves
- Differential: LVH, HOCM, LVH + ACS
Any condition causing an increase in pressure will result in left ventricular hypertrophy. A thicker wall will cause a prolonged depolarisation because there is a larger cardiac mass for electricity to pass through (ie a longer R wave peak time and an increased QRS amplitude) and a delayed repolarisation for the same reasons (with ST and T wave changes – note these can mimic ischaemia but are often discordant to the direction of the QRS) The increased amplitude of QRS leads to an increased R wave in the L sided ECG leads (1, aVL, V4-6) and an increased S wave seen in the right sided leads (III, AVR, V1-3)
To diagnose LVH you must meet both voltage and non-voltage criteria.
- Voltage criteria: there are many, the commonest being Sokolov Lyon (depth of S wave in V1 and R wave in V5/6 > 35mm)
- Non-voltage criteria: either a delayed R wave peak time of >50ms as seen in V5 or V6, OR left sided strain pattern (STD and TWI)
Causes of LVH:
- HTN
- Valvular disease: AS, AR, MR
- Hypertrophic cardiomyopathy
Clinical closure: on further questioning this lady was known to have HOCM.
Further Reading – Textbook:
Chan TC, Brady WJ, Harrigan RA, Ornato JP, Rosen P. ECG in Emergency Medicine and Acute Care. Elsevier Mosby 2005.