
ECG of the Week 30th November 2022 – Interpretation
This ECG was used to illustrate how a systematic approach ensures that no components of the ECG interpretation are missed when there are multiple abnormalities.
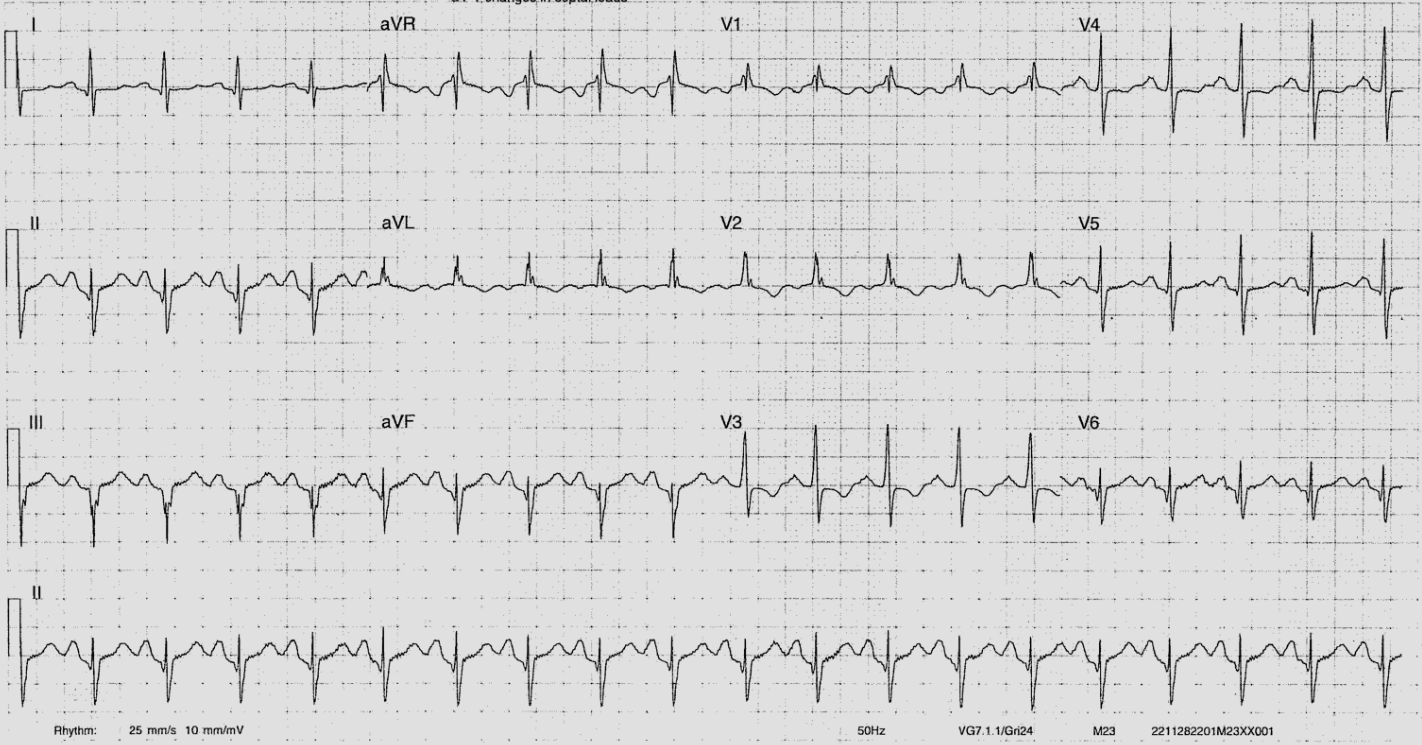
The rhythm is sinus and the rate is ~120 beats per minute. Consider the multitude of pathological or physiological causes of sinus tachycardia – pulmonary embolism, anaemia, increased myocardial oxygen demand (fever, infection, coronary ischaemia), pregnancy, anxiety, stimulant medications (prescribed or illicit), endocrine disorders (thyroid or adrenal disease). There are many others.
The P waves are abnormal. There is evidence of P mitrale with biphasic P waves in V1 whereby the negative portion of the P wave is > 40ms in duration and > 1mm deep. I can’t truly convince myself that the P wave in lead II is bifid, but it is as large in amplitude as the preceding T wave. P mitrale represents LA enlargement, predisposing the patient to atrial fibrillation (these patients end up in chronic AF with time), and can be caused by a number of pathologies – mitral valve lesions (classically stenosis, but also seen in regurgitation), causes of LV hypertrophy (systemic hypertension, aortic stenosis, HCM).
There is left axis deviation. In this patient, this could be caused by – left anterior fascicular block, left ventricular hypertrophy, or inferior MI. LBBB, ectopy, or a paced rhythm will also show left axis deviation.
The QRS complexes show an RSR’ pattern but are narrow, measuring 90ms (this can be a normal variant). There are Q waves inferiorly in leads II, III, aVF – her previous MI likely affected her inferior LV, and we may expect that she had an RCA lesion stented.
There is ST depression in V3 and V4 as well as T wave inversion in V1 – V4. This may be a chronic change secondary to a previous infarct, or may signify ongoing more acute ischaemia. It is worth noting that ST segment depression or T wave inversion cannot be used to localise the territory of ischaemia (unlike with ST elevation).
The QT segment is within normal limits.
What might we expect to see on echocardiography – LV function may be reduced from ischaemic heart disease (there may be regional wall motion abnormality with the inferior segments of the LV being compromised). If there is LAFB, there may be dyskinetic movement of the LV walls as the left anterior fascicles depolarise later and the LV segments supplied may contract later. We expect the LA to appear dilated, and there may be a mitral valve lesion. If the mitral valve is normal, we may expect there to be concentric hypertrophy of the LV. There may be mild to moderate aortic stenosis as well. There are no ECG signs to expect there to be a pericardial effusion. It is more difficult to comment on the right heart as the ECG looks predominantly at the left heart, but we would be interested in whether there is elevated pulmonary pressures and what the RV function is given a proximal RCA infarct could affect the RV function as well.